Newsroom
Peter Brandt Sees Chart Patterns as Basis for Potential XRP Trade
27 September, 2026 / News / AI / Tags: brandt, xrp, chart, charts, september
Veteran trader cites long-term price history as sufficient reason to consider a position in XRP while distancing himself from fervent supporter loyalty
Veteran commodities trader Peter Brandt stated that XRP’s long-term charts alone provide enough reason to consider a bet on the token, according to a post published on September 26, 2026. Brandt, founder of Factor Trading, made the comments while noting a clear distinction between open-minded interest and unquestioning support for the asset.
In the post, Brandt wrote that it is not necessary to be a certified cult member to be an interested owner of XRP. He added that the charts alone have always been enough reason to make a bet and that there is a difference between being open-minded and having a hole in the head.
The accompanying chart covered more than a decade of XRP price history and was dated September 26, 2026. It highlighted two extended periods of narrowing trading ranges that preceded sharp advances, along with a smaller pattern following a recent decline. At the time of the chart, XRP traded near $1.52, below its weekly high of about $1.66 but up roughly 7.9 percent for the week.
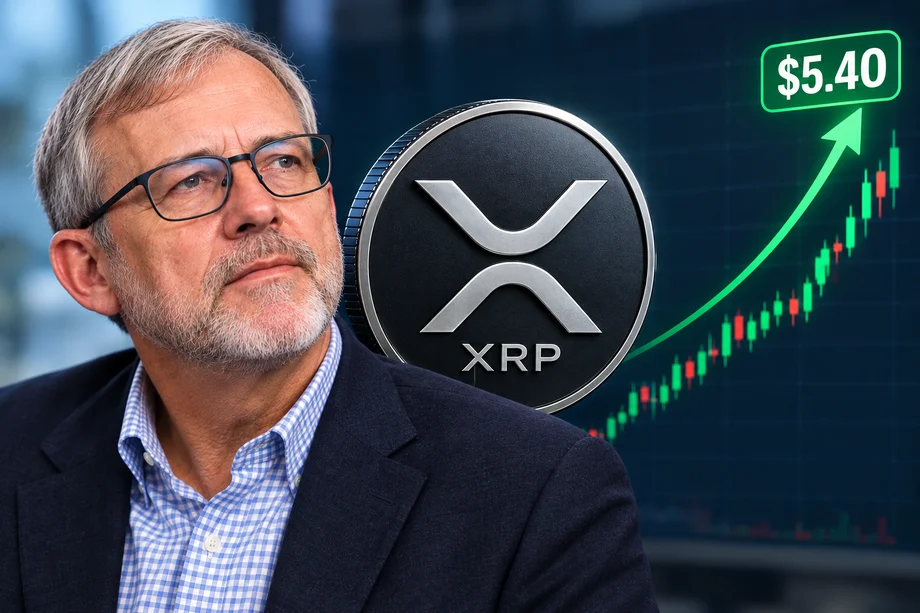
Earlier Projection to $5.40
Brandt’s latest remarks followed a September 21 chart in which he indicated an eventual advance toward $5.40. At that time XRP traded near $1.54, placing the projected level approximately 251 percent higher. The September 21 image did not specify a timetable for reaching that target and did not confirm that Brandt had opened a position.
The more recent post did not repeat the $5.40 figure or introduce a new price objective. It focused instead on the broader principle that technical patterns alone can justify interest in the token.
No Confirmed Position or Timetable
Brandt did not state that he had bought or sold XRP. His wording about making a bet stopped short of confirming that any trade had been executed. The posts contained no schedule for a potential move higher or lower.
This approach is consistent with Brandt’s earlier commentary. In November 2024 he described an XRP price pattern as a massive coil while stating that he held no long position and had no plans to buy the token at that time.
Context of Recent Price Action
XRP had climbed above $1.60 on September 22 before the pullback captured in the September 26 chart. During the advance, data showed elevated large transfers and an increase in new wallet addresses, though the latter figure counts addresses rather than confirmed new investors.
Brandt’s analysis relies on classical technical charting methods he has applied since entering commodity markets in 1976. His comments center on historical price formations rather than fundamental valuation or any formal investment recommendation.
The September 26 post and the preceding $5.40 projection therefore present a technical view of multi-year patterns without establishing an active trade or a firm timeline for future price movement.

Disclaimer
This article was generated by AI using information from multiple industry sources. It has not been reviewed or verified by a human editor and may contain inaccuracies, omissions, or misinformation. Readers are encouraged to independently verify any information before making decisions based on its content.Tired of the noise?
Let the bots trade for you.
Trade 24/7, without emotion, with data-driven strategies.
Associated articles


Latest articles

Scammer Loses $4.8 Million in Bitcoin on Tampered Ledger Devices

Visa Moves USDC Prefunding for Cross-Border Payouts into Commercial Production

Schwab Rolls Out Bitcoin and Ether Trading to Millions of Retail Clients

U.S. Fiscal 2026 Deficit Climbs to $1.99 Trillion as Interest Payments Surge