Newsroom
Bitcoin Monte Carlo Simulations Point to Median Value of $1.03 Million in 2033
27 October, 2026 / News / AI / Tags: percentile, median, simulation, simulations, woo

Analyst Willy Woo's detailed model, drawing on 10,000 price paths, indicates a median Bitcoin trajectory reaching $1.03 million in February 2033 after a 2028 peak around $413,000
Bitcoin Simulations Reveal Cycle Patterns and Returns
On-chain analyst Willy Woo ran a Monte Carlo simulation using 10,000 random price paths for Bitcoin. The model draws from historical data covering the 2018 market bottom to the 2022 bottom and incorporates Bitcoin's current position within its cycle. It applies a power-law decay setting of 0.45, which reduces expected returns in successive cycles as the asset grows larger.
Woo emphasized that the simulation serves as a statistical mapping tool rather than a precise forecast. He highlighted a specific path falling in the 29th percentile as reasonable for analysis. This path tops near $241,000 in December 2028 before declining sharply. Woo noted the broader 28th to 50th percentile range for the 2028 high sits between $241,000 and $413,000, describing these levels as plausible given today's market dynamics.
The model accounts for structural shifts in Bitcoin trading since 2018, including the rise of derivatives, exchange-traded funds, and rapid liquidations. Older periods featuring easy 100x gains are no longer relevant, so the simulation excludes them to reflect contemporary conditions.
Median Path and Extreme Outcomes in the Simulations
Along the median simulation path, Bitcoin climbs to a cycle high of $413,000 in December 2028. It then falls to around $234,000 by April 2030. The 29th percentile path reaches $241,000 at its peak in late 2028 and bottoms at $126,000 in April 2030. At the higher end, the 90th percentile scenario projects $1.44 million by March 2029. On the lower side, the 10th percentile path drops to $51,900 by April 2030.
Another related analysis using 5,000 simulations projects median prices of $170,000 by the end of 2027, $266,000 by the end of 2028, and $537,000 by the end of 2030. By the end of 2034, its 95th percentile outcome reaches about $5.62 million, while the 5th percentile sits at $464,000. One variant of the exercise shows a worst-case price of $116,000 in December 2028 and a best-case value of $5.8 million by year-end 2033.
| Simulation Outcome | Period | Price Level |
|---|---|---|
| Median path high | December 2028 | $413,000 |
| 29th percentile peak | December 2028 | $241,000 |
| 90th percentile high | March 2029 | $1.44 million |
| Median path low | April 2030 | $234,000 |
| 29th percentile low | April 2030 | $126,000 |
| 10th percentile low | April 2030 | $51,900 |
| End-2034 high | End 2034 | $5.62 million |
| End-2034 low | End 2034 | $464,000 |
| Worst-case reference | December 2028 | $116,000 |
| Best-case reference | End 2033 | $5.8 million |
Broader Influences on Long-Term Bitcoin Performance
Multiple factors could shape actual Bitcoin price developments over the coming years. Weekly Federal Reserve reports, including potential rate adjustments, remain close watchpoints. ETF flow trends, which showed net outflows of around $1 billion in recent days, also factor into near-term sentiment. Midterm elections and ongoing geopolitical or regulatory shifts may add further layers of uncertainty.
Analysts across the reviewed models stress that historical patterns offer only directional guidance. Power-law decay implies smaller percentage gains in later cycles, pushing seven-figure targets further into the future. The simulations assume market structures similar to the post-2018 era, and any major departure could alter the projected paths. One cycle rule references a 500-day halving framework that has historically aligned sell periods around 2029.
Woo highlighted that the highlighted simulation path does not reach $1 million, instead requiring more than six years from current levels in the median scenario. The exercise underscores the range of possible outcomes rather than pinpointing any single future price.

Disclaimer
This article was generated by AI using information from multiple industry sources. It has not been reviewed or verified by a human editor and may contain inaccuracies, omissions, or misinformation. Readers are encouraged to independently verify any information before making decisions based on its content.Tired of the noise?
Let the bots trade for you.
Trade 24/7, without emotion, with data-driven strategies.
Associated articles

Bernstein Forecasts Bitcoin at $150,000 by Mid-2027, Trims Strategy Target
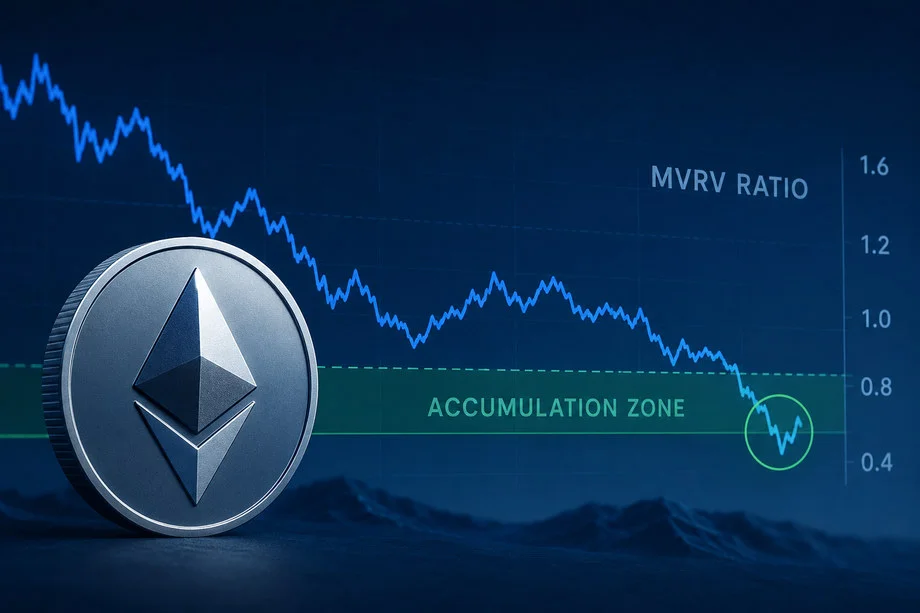
Ethereum MVRV Ratio Drops Below 0.8 Marking Potential Accumulation Phase

VanEck Signals Bitcoin Correction May Be Nearing End as Capitulation Indicators Cluster

Bitcoin Supply Held at Loss Tops 50% as Cycle Bottom Nears

Bitcoin Reaches $58,000 Support as Samson Mow Calls Market Bottom
Latest articles

Zcash Co-Founder Proposes Redirecting 8% of Block Subsidies to Network Reserve

S&P Global Completes Acquisition of OpenZeppelin Smart Contract Security Firm

Franklin Templeton Files Two ETFs to Convert US Stock Dividends into Bitcoin

Microsoft Offers Voluntary Buyouts to 60,000 Employees Amid $175 Billion AI Outlay