
The Sandbox to Reimburse Eligible SAND Holders 1:1 After Bridge Exploit
Blockchain gaming platform will cover roughly $700,000 in losses from its treasury following an August 21 incident that drained 14.7 million tokens from an Ethereum vault
Cryptocurrencies
 The SandboxSAND
| Year | January | February | March | April | May | June | July | August | September | October | November | December | Average | Median |
|---|---|---|---|---|---|---|---|---|---|---|---|---|---|---|
| 2026 | +5.5% | -18.2% | -12.8% | -4.6% | -3.8% | -32.9% | -11.6% | -13.2% | +0.2% | - | - | - | -10.2% | -11.6% |
| 2025 | -2.3% | -40.5% | -15.1% | +7.2% | -8.7% | -8.0% | +19.8% | -0.7% | -3.8% | -25.8% | -23.2% | -25.2% | -10.5% | -8.3% |
| 2024 | -23.5% | +27.4% | +13.9% | -37.0% | +4.9% | -24.6% | -2.2% | -17.6% | +15.5% | -4.9% | +168.2% | -18.7% | +8.5% | -3.5% |
| 2023 | +88.6% | -2.4% | -9.7% | -5.8% | -4.1% | -23.7% | +2.7% | -23.6% | +1.5% | +15.1% | +19.0% | +41.2% | +8.2% | -0.5% |
| 2022 | -33.8% | -29.3% | +9.5% | -32.1% | -26.9% | -26.9% | +18.9% | -27.0% | -9.5% | +2.2% | -35.4% | -34.4% | -18.7% | -27.0% |
| 2021 | +146.8% | +194.4% | +276.5% | -29.5% | -49.8% | -32.1% | +166.5% | +51.4% | -36.8% | +171.3% | +346.8% | -13.2% | +99.3% | +99.1% |
| 2020 | - | - | - | - | - | - | - | +2.1% | -37.7% | -22.7% | +28.7% | -25.0% | -10.9% | -22.7% |
| Average | +30.2% | +21.9% | +43.7% | -17.0% | -14.8% | -24.7% | +32.4% | -4.1% | -10.1% | +22.5% | +84.0% | -12.6% | ||
| Median | +1.6% | -10.3% | -0.1% | -17.7% | -6.4% | -25.8% | +10.8% | -13.2% | -3.8% | -1.3% | +23.9% | -21.9% |
| Exchange | Price | 24H Volume | 7D Volume | 1M Volume | 6M Volume | 12M Volume | YTD Volume | Monitored since | Tick size | Step size |
|---|---|---|---|---|---|---|---|---|---|---|
 Binance Binance | 0.03827 | 2.55M | 8.24M | 37.72M | 280.13M | 958.6M | 560.34M | 2020-08-14 | 0.00001000 | 1.00000000 |
Currently, we don't have any historical trades.
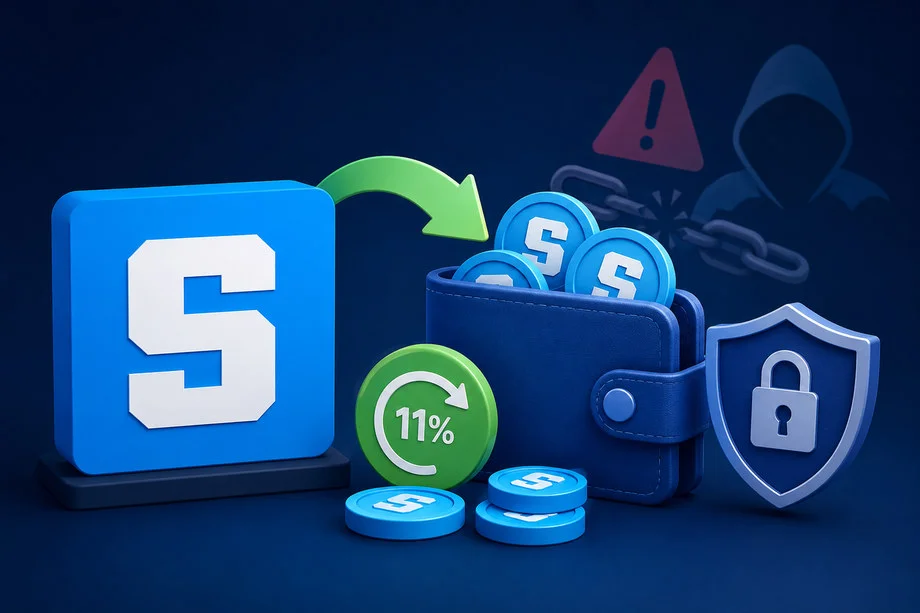
Blockchain gaming platform will cover roughly $700,000 in losses from its treasury following an August 21 incident that drained 14.7 million tokens from an Ethereum vault
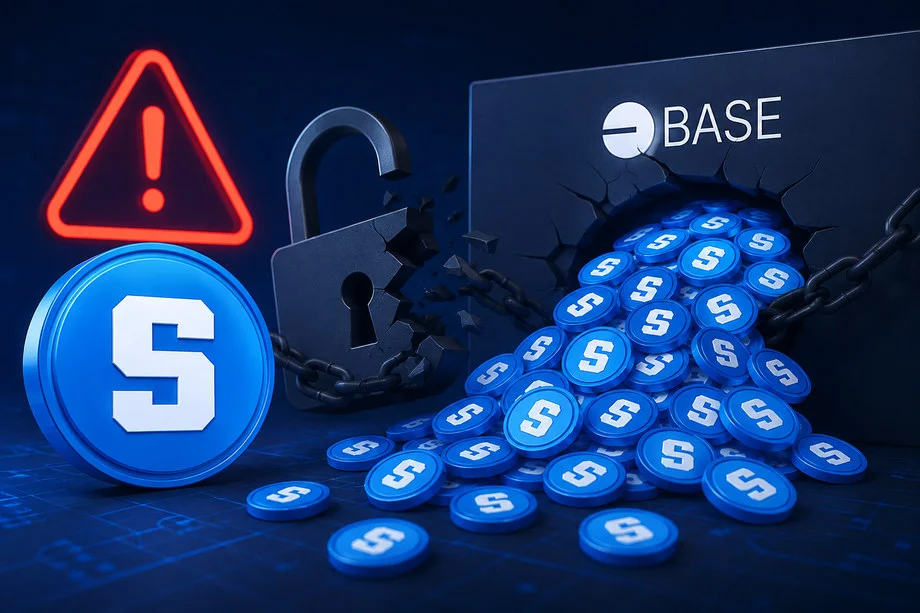
Security firms reported an ongoing infinite mint attack on the SAND OFT contract, with conflicting estimates of newly created tokens, before the project halted bridging and confirmed limited impact